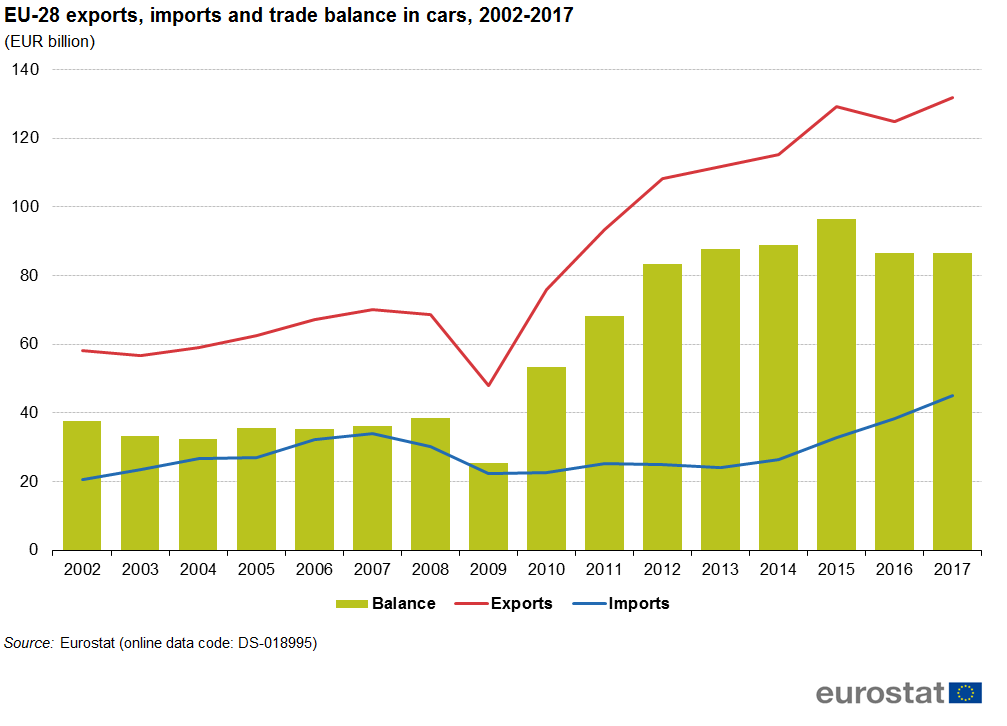
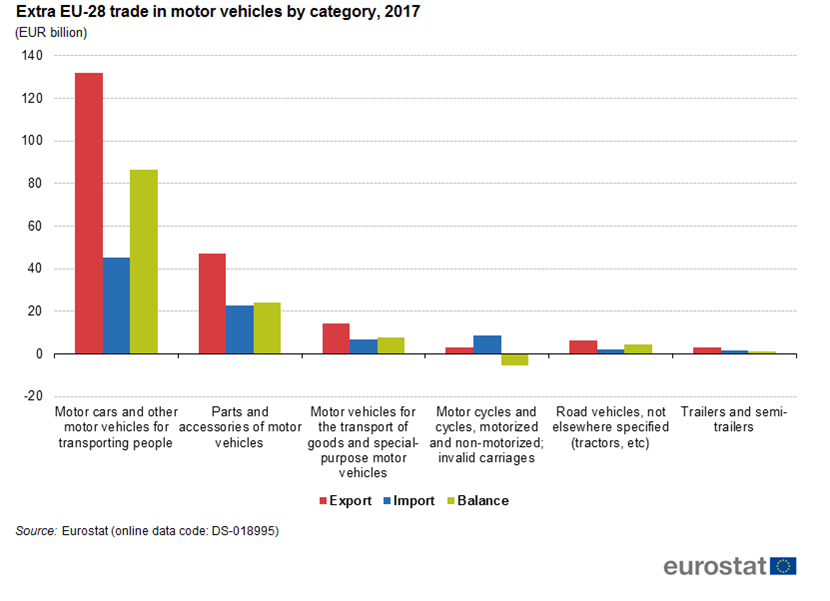
In 2017, the EU exported EUR 132 billion worth of cars. Imports in that same year amounted to EUR 45 billion, giving the EU a trade surplus of EUR 87 billion (Figure 1). The value of extra-EU exports of cars increased by an average of 5.6 % per year between 2002 and 2017 while imports grew at an average of 5.4 % per year.
In 2002, the share of cars in total EU exports of goods was 6.5 % (Figure 2). This share dropped to 4.4 % in 2009 and peaked at 7.2 % in 2015 and 2016. It dropped slightly to 7.0 % in 2017. The share of cars in total EU imports of goods did not fluctuate as much. It was 2.2 % in 2002, peaked at 2.6 % in 2004, had a low of 1.4 % in 2012 and 2013 and reached 2.4 % in 2017.
Who are the EU's partners in trade of cars?
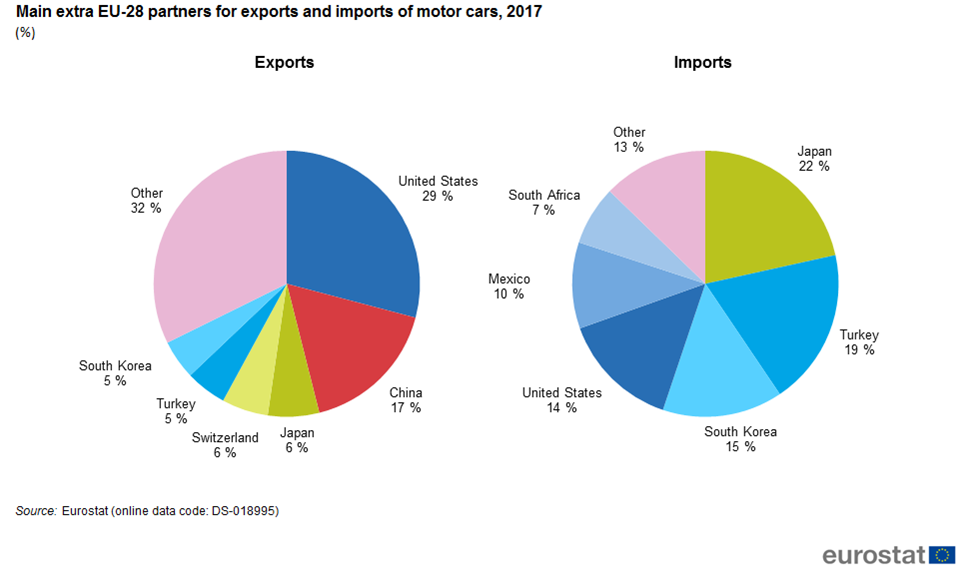
In 2017, the United States was the main export destination of EU's cars (29 % of the total), well ahead of China (17 %) (Figure 3). Japan (6 %), Switzerland (6 %), Turkey (5 %) and South Korea (5 %) completed the top 6. These six made up a little over two thirds of extra-EU exports of cars.
With 22 % Japan was the main origin of extra-EU imports, 3 percentage points ahead of Turkey (19 %) which had been the main import partner in 2016. They preceded South Korea (15 %), the United States (14 %), Mexico (10 %) and South Africa (7 %). Together the top six made up 87 % of all extra-EU imports of cars. It should be noted that exports and imports relate to production within the corresponding country, regardless of the nationality of the factory.
Between 2002 and 2008, exports of cars to the United States had already fallen from EUR 28 billion to EUR 21 billion (Figure 4) but in 2009 they declined to EUR 13 billion, losing EUR 8 billion in only one year. However there was a strong resurgence of exports, gaining EUR 15 billion between 2009 and 2013 and EUR 13 billion in the next two years, thus peaking at 40 billion in 2015. After this peak there was a decline to EUR 38 billion in 2016 and 2017.
Imports from the United States grew from EUR 4 billion in 2002 to EUR 6 billion in 2008 but then halved in 2009. In most of the following years (exceptions in 2011 and 2016) they grew, peaking at EUR 7 billion in 2016 and reaching EUR 6 billion in 2017. During the whole period the EU had a trade surplus for cars with the United States. It was lowest in 2009 (EUR 10 billion), peaking in 2015 (EUR 33 billion) and then falling to EUR 32 billion in 2017.
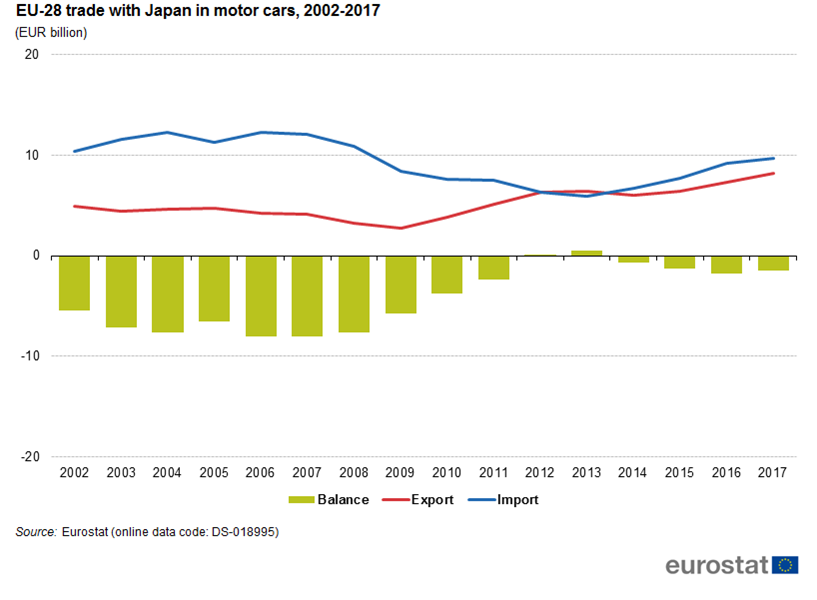
In 2002 exports of cars to Japan amounted to EUR 5 billion which after some fluctuations dropped to EUR 3 billion in 2009 (Figure 5). After that they grew in every year except 2014 and consequently reached a new high of EUR 8 billion in 2017. EU imports from Japan were EUR 10 billion in 2002 and hovered around EUR 11 to 12 billion until 2008. The next years they dropped until bottoming out at EUR 6 billion in 2013 after which they started growing again. In 2017 imports reached EUR 10 billion, which was still below its previous peak in 2004.
Between 2002 and 2011 the EU had a trade deficit for cars with Japan which peaked at EUR 8 billion in 2006 and 2007. In 2012 and 2013 the EU had a small trade surplus. From 2014 (EUR 1 billion) to 2017 (EUR 2 billion) there was again a trade deficits but much smaller than it had been earlier.
Japan (21 times ), Turkey (20 times ) and South Korea (17 times) appear most often as a top three partner for imports of cars by EU Member States, well ahead of the other countries which appear between 1 and 4 times (Figure 6). Only Germany and Lithuania have a top three without Japan, Turkey and Korea. In total there are 13 different countries as a top three partner for the Member States.
There is more variation in export destinations where a total of 33 countries appear as a top three partner for the EU Member States (Figure 7). However 29 of these partners appear three times or less. Only China (13 times), the United States (10 times), Switzerland (9 times) and Turkey (7 times) appear seven times or more. Proximity plays a role in exports, as can be seen in the top partners for Greece (Egypt), France (Switzerland), Lithuania (Belarus), Hungary (Serbia), Malta (Libya), Romania (Turkey) and Finland (Russia).
Germany is the EU's largest exporter of cars
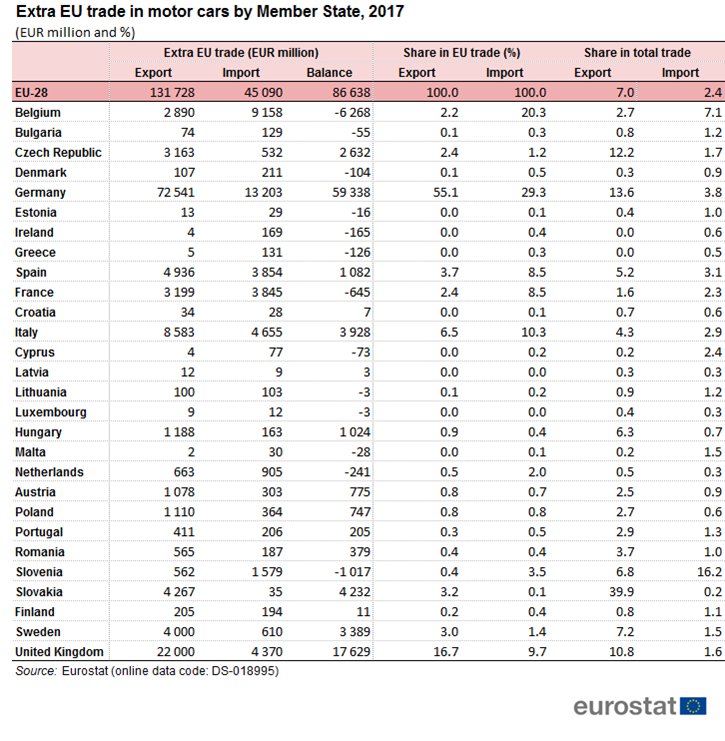
Looking at the trade in cars by individual Member State, Germany alone was responsible for well over half (55 %) of the EU total exports in 2017 (Table 1). The United Kingdom, ranking second, registered a sixth (17 %) of the EU total exports. In relative terms, i.e. compared to their total extra-EU export, cars represented 13.6 % of Germany's total exports. This share was surpassed only by Slovakia (39.9 %). The Czech Republic (12.2 %) and the United Kingdom (10.8 %) were the only other Member States whose share of cars in total exports of goods was higher than 10 %.
With a trade value of EUR 13 billion in 2017, Germany’s share in total EU imports of cars was the most significant (29 % of the EU imports), followed by Belgium (20 %), Italy and the United Kingdom (both 10 %). For most member states imports of cars made up less than 3 % of their total imports of goods. Only four countries had higher shares: Spain (3.1 %), Germany (3.8 %), Belgium (7.1 %) and Slovenia (16.2 %). Thirteen Member States had trade deficits in 2017, Belgium (EUR 6.3 billion) and Slovenia (EUR 1.0 billion) were the only two to exceed one billion.
The largest trade surpluses in 2017 were achieved by Germany (EUR 59.3 billion) and the United Kingdom (EUR 17.6 billion). Hungary (EUR 1.0 billion), Spain (EUR 1.1 billion), the Czech Republic (EUR 2.6 billion), Sweden (EUR 3.4 billion), Italy (EUR 3.9 billion) and Slovakia (EUR 4.2 billion) also had surpluses of more than EUR 1 billion.
The subcategory 'cars and other motor vehicles for transporting people', described above as cars, was the largest of the six subcategories that make up the category motor vehicles. Its exports were worth EUR 132 billion (64 % of motor vehicles) and its imports were EUR 45 billion (52 % motor vehicles) in 2017 (Figure 8). ‘Parts and accessories of motor vehicles’ followed with exports of EUR 47 billion (23 %) and imports of EUR 23 billion (26 %). Two other sectors are noteworthy: ‘Motor cycles and cycles’ are mainly imported (EUR 8 billion, 10 %) and ‘Motor vehicles for the transport of goods’ have exports of EUR 14 billion (7 %) and imports of EUR 7 billion (8 %). ‘Motor cycles and cycles’ is the only subcategory where the EU had a trade deficit which amounted to EUR 5.5 billion.
Source data for tables and graphs
Data source
EU data comes from Eurostat’s COMEXT database.
COMEXT is the Eurostat reference database for international trade in goods. It provides access not only to both recent and historical data from the EU Member States but also to statistics of a significant number of non-EU countries. International trade aggregated and detailed statistics disseminated from Eurostat website are compiled from COMEXT data according to a monthly process. Because COMEXT is updated on a daily basis, data published on the website may differ from data stored in COMEXT in case of recent revisions.
European statistics on international trade in goods are compiled according to the EU concepts and definitions and may, therefore, differ from national data published by Member States.
Product classification Products of the road vehicles sector are defined according to the fourth revision of the Standard international trade classification. They include divisions for 781 cars and other motor vehicles for transporting people; 782 Motor vehicles for the transport of goods and special-purpose motor vehicles; 783 Road vehicles, not elsewhere specified (tractors, etc); 784 Parts and accessories of motor vehicles; 785 Motor cycles and cycles, motorized and non-motorized; invalid carriages; and 786 Trailers and semi-trailers.
Unit of measure Trade values are expressed in millions (106) of euros. They correspond to the statistical value, i.e. to the amount which would be invoiced in case of sale or purchase at the national border of the reporting country. It is called a FOB value (free on board) for exports and a CIF value (cost, insurance, freight) for imports.
Context
Trade is an important indicator of Europe’s prosperity and place in the world. The bloc is deeply integrated into global markets both for the products it sources and the exports it sells. The EU trade policy is an important element of the external dimension of the 'Europe 2020 strategy for smart, sustainable and inclusive growth’ and is one of the main pillars of the EU’s relations with the rest of the world.
Because the 28 EU Member States share a single market and a single external border, they also have a single trade policy. EU Member States speak and negotiate collectively, both in the World Trade Organization, where the rules of international trade are agreed and enforced, and with individual trading partners. This common policy enables them to speak with one voice in trade negotiations, maximising their impact in such negotiations. This is even more important in a globalised world in which economies tend to cluster together in regional groups.
The openness of the EU’s trade regime has meant that the EU is the biggest player on the global trading scene and remains a good region to do business with. Thanks to the ease of modern transport and communications, it is now easier to produce, buy and sell goods around the world which gives European companies of every size the potential to trade outside Europe.

